Performance dispersion is a golden opportunity for active investors
Discover how ample the performance dispersion is across stocks and learn how you can profit from it. Every investment universe exhibits a broad performance dispersion.
Whatever your investment approach and selection strategy is, you can exploit the broad performance dispersion, existing in your own investment universe.
S&P 500 Investment Universe
2023 Performance Dispersion Facts:
Top 25% Performers (Average Return)
+50%
Index
+24%
Bottom 25% Performers (Average Return)
-17%
2022 Performance Dispersion Facts:
Top 25% Performers (Average Return)
+22%
Index
-19%
Bottom 25% Performers (Average Return)
-44%
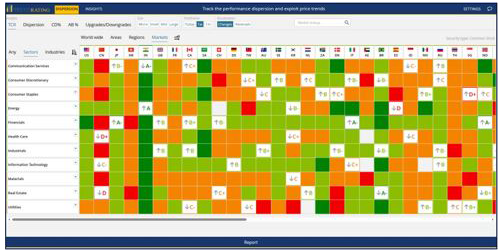
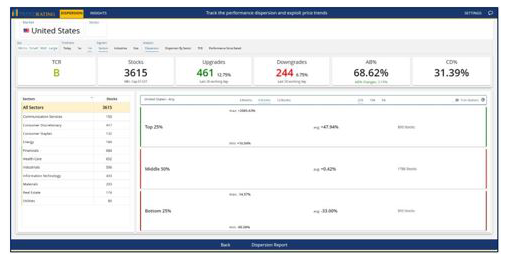
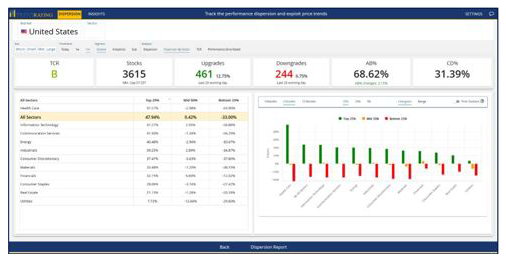
Below you can find free up-to-date statistics to measure and analyze the dispersion in the markets and sectors of your interest. Next you can learn how to exploit dispersion by discriminating between best and worst performers.
Performance dispersion data - Discover the magnitude of dispersion.
See the dispersion insights at market and sector level below.
Click on the flag in order to get the desired report.
I simply would like to offer you a huge thumbs up for the great information you provide here. I will be coming back to your blog for more soon.
Wealth Manager, US
It’s nearly impossible to find educated people in this particular subject. However, you
seem like you know what you’re talking about! Thanks.
Asset Manager, Swizerland
You certainly put a new spin on a topic that's been written about for decades. Wonderful stuff. Do not stop!
Fund Manager, Singapore
Proft from performance dispersion with smarter analytics and technology!
Track the dispersion in real time and profit from it!
Analyzing the performance dispersion across markets and sectors enables investors to make more informed investment decisions. Trendrating offers free access to critical market intelligence covering dispersion statistics on different time windows.
Gain free access to our alpha dispersion monitoring service. Fill the below form and a
Trendrating representative will contact you within 24 hours
How can you profit from the dispersion inherent in your investment universe?
Our trend discovery model provides a rating metric to discriminate bull vs. bear trend and to quickly spot trend reversals across stocks with a high level of accuracy.
Why it works?
Our approach works because is agnostic, opportunistic, pragmatic and unbiased, as it is based on a multi-factors AI pattern recognition model that avoids any human interpretation and forecast. Our fresh, innovative data and technology delivers a layer of logical market intelligence whose value is fully transparent and measurable.
Evidence of accuracy
Our 250+ clients use Trendrating advanced analytics to gain critical insights and profit from performance dispersion. Here you find a few links to documented evidence of the effectiveness of Trendrating analytics:
Better Information ● Better Decisions ● Better Investing
Gain a critical edge and expand your market intelligence.
Make trends work for you.
Do not miss profitable opportunities anymore.
Start boosting your investment returns.
Discover how our solution can give you an edge. Fill the below form and take a 15-minute demo session, focusing on the investment universe of your interest.
About Trendrating
Trendrating is a global leader in the field of advance analytics and trend capture technology. We offer a new, different set of analytics and tools to measure performance dispersion and rate price trends, filtering out market noise, arguable opinions and disputable research. Serving more than 250 institutional customers globally, our proprietary methodologies are used as part of their investment decision-making process in wealth management, private banking, advisory and hedge fund fields to maximize returns and better control risks. Our key strategic partners include Bloomberg and Euronext.